Financial Information
Financial Highlights (Consolidated)
![]()
(Million yen)
| FYE Mar. 2021 | FYE Mar. 2022 | FYE Mar. 2023 | FYE Mar. 2024 | FYE Mar. 2025 | |
|---|---|---|---|---|---|
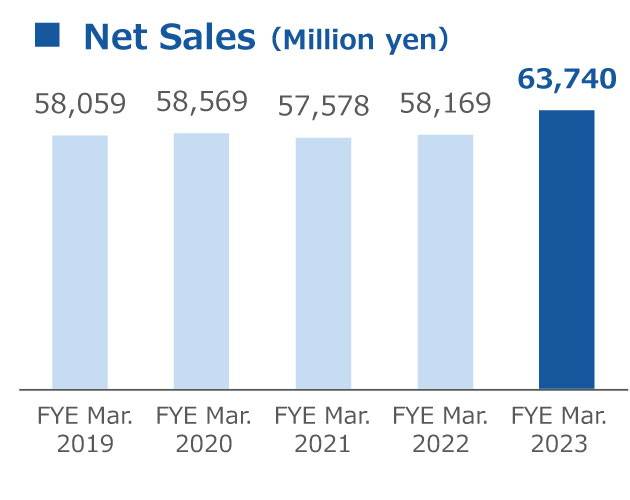
| Net Sales | 57,578 | 58,169 | 63,740 | 65,292 | 69,749 |
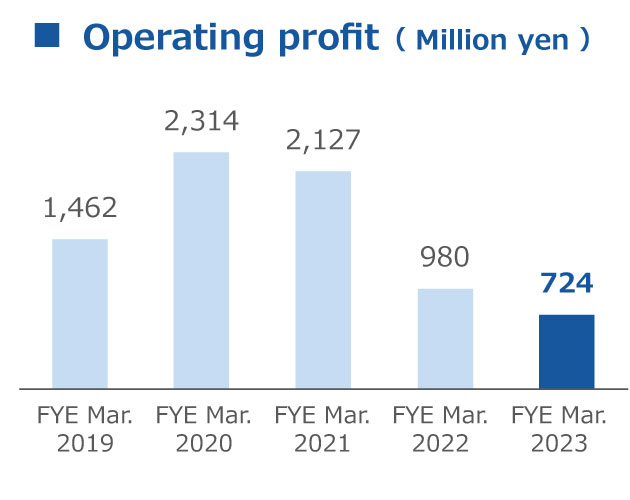
| Operating profit | 2,127 | 980 | 724 | △ 268 | 872 |
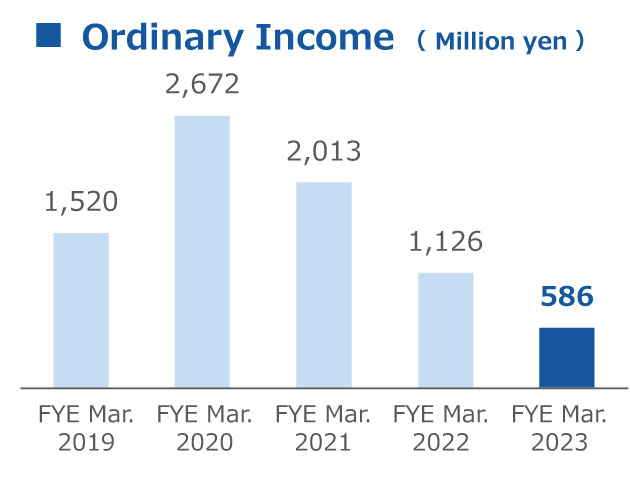
| Ordinary Income | 2,013 | 1,126 | 586 | 145 | 514 |
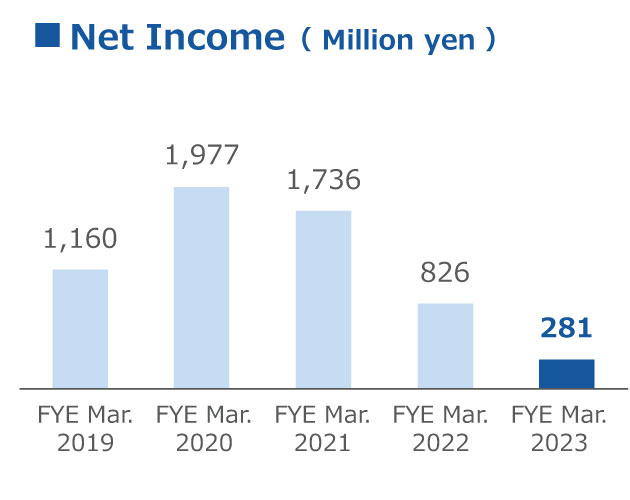
| Net Income | 1,736 | 826 | 281 | △ 36 | 89 |
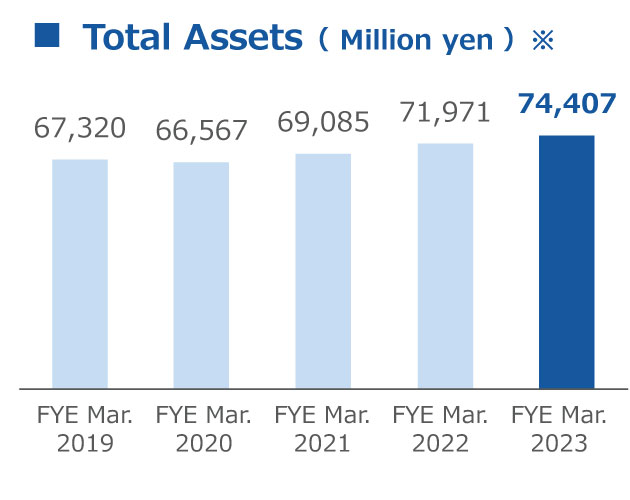
| Total Assets* | 69,085 | 71,971 | 74,407 | 84,709 | 81,432 |
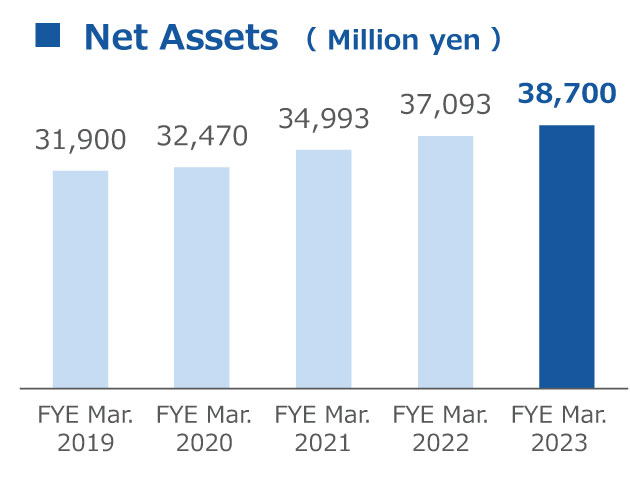
| Net Assets | 34,993 | 37,093 | 38,700 | 40,747 | 40,927 |
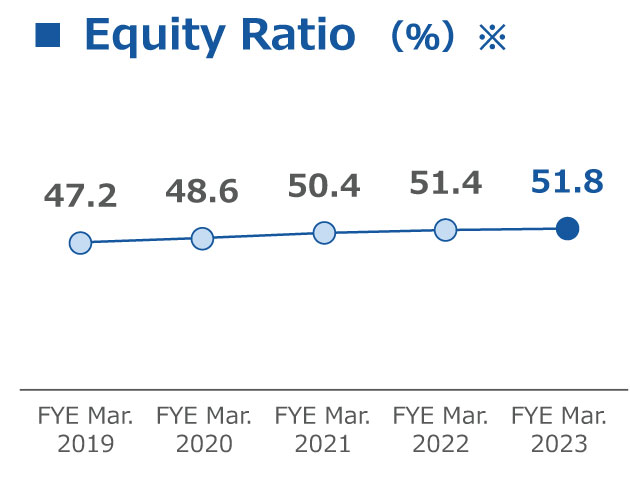
| Equity Ratio (%)* | 50.4 | 51.4 | 51.8 | 47.9 | 50.1 |
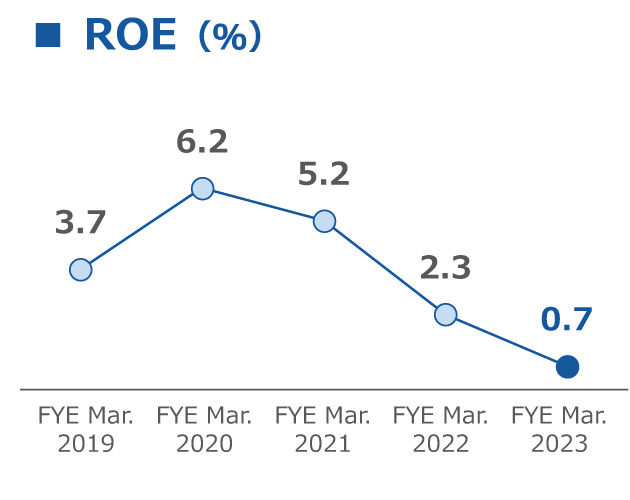
| ROE (%) | 5.2 | 2.3 | 0.7 | △ 0.1 | 0.2 |
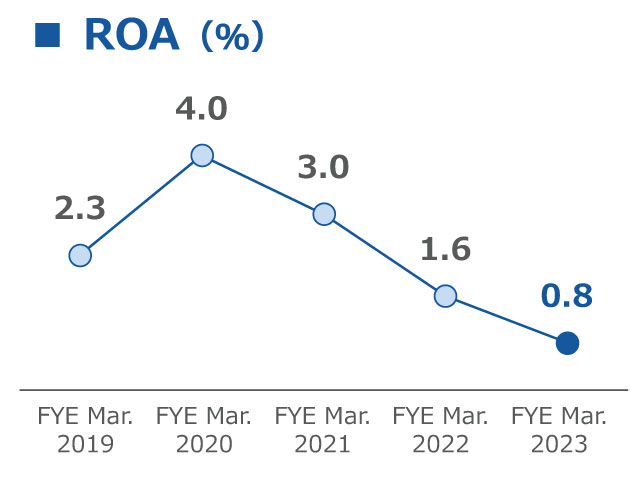
| ROA (%) | 3.0 | 1.6 | 0.8 | 0.2 | 0.6 |
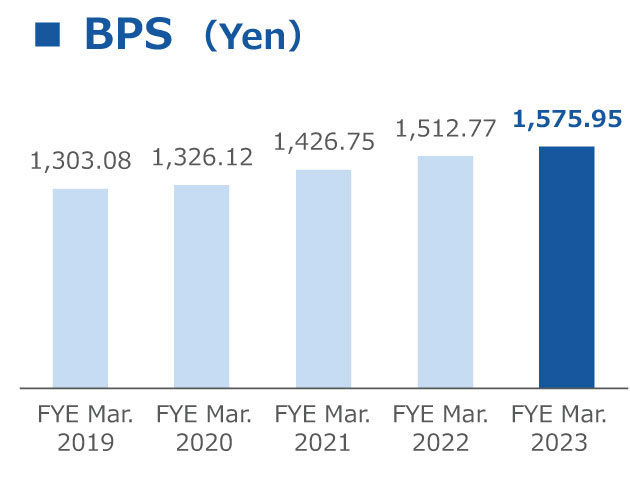
| BPS (Yen) | 1,426.75 | 1,512.77 | 1,575.95 | 1,657.29 | 1,666.51 |
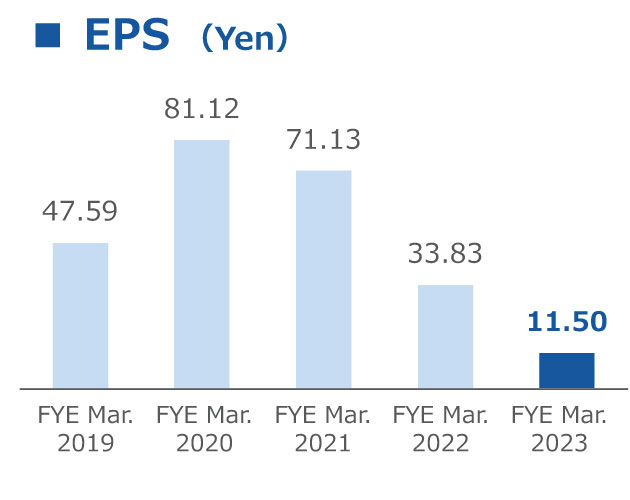
| EPS (Yen) | 71.13 | 33.83 | 11.50 | △ 1.48 | 3.65 |
* The Company applied "Partial Amendments to Accounting Standard for Tax Effect Accounting" ( Corporate Accounting Standard No. 28, February 16, 2018) beginning in the fiscal year ending March 31, 2019.
Cash flow trends
![]()
(Million yen)
| FYE Mar. 2021 | FYE Mar. 2022 | FYE Mar. 2023 | FYE Mar. 2024 | FYE Mar. 2025 | |
|---|---|---|---|---|---|
| Cash flows from operating activities | 3,739 | 4,399 | 2,485 | 3,140 | 1,467 |
| Cash flows from investing activities | △ 3,251 | △ 3,677 | △ 3,691 | △ 4,239 | △ 3,132 |
| Cash flows from financing activities | △ 535 | △ 499 | 525 | 4,775 | △ 3,186 |
| Cash and cash equivalents at end of period | 6,222 | 6,810 | 6,325 | 10,304 | 5,507 |
Other data
(Million yen)
| FYE Mar. 2021 | FYE Mar. 2022 | FYE Mar. 2023 | FYE Mar. 2024 | FYE Mar. 2025 | |
|---|---|---|---|---|---|
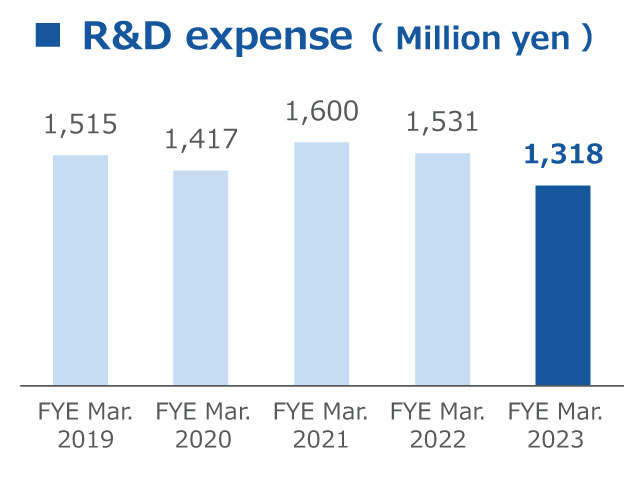
| R&D expense | 1,600 | 1,531 | 1,318 | 1,518 | 1,532 |
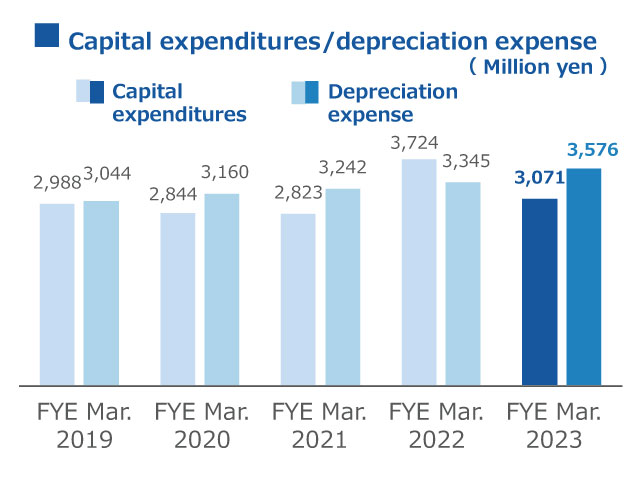
| Capital expenditures | 2,823 | 3,724 | 3,071 | 5,490 | 3,026 |
| Depreciation expense | 3,242 | 3,345 | 3,576 | 3,700 | 3,851 |


